| Table of Contents |
|---|
Campaign Status
| Rw ui textbox macro | ||
|---|---|---|
| ||
Menu for supervising campaign status. The module of campaign monitoring is divided into five tabs that will have different views of the campaigns that the supervisor has assigned. This ones are
|
Campaign Summary
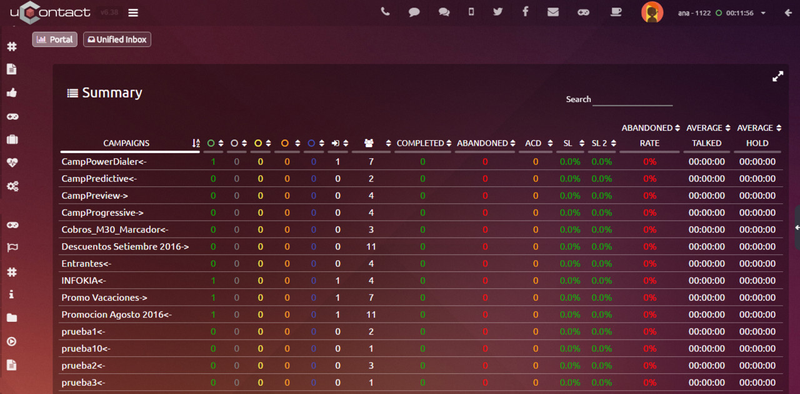
Basic statistics as a summary of the status of queues in real time.
| Expand | ||
|---|---|---|
| ||
Here the user is able to see:
|
| Rw ui textbox macro | ||
|---|---|---|
| ||
This dashboard is mainly targeted for deployment at the level of call centers that require display information with real-time alerts on monitors or LCD displays. |
| Rw ui textbox macro | ||
|---|---|---|
| ||
On the top right of the screen we can set the dashboard on Full screen mode. Search Allows to filter the list. By clicking on a campaign the user can access directly to the selected campaign status. |
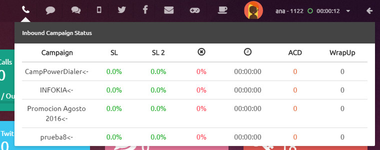
The Supervisor, on the notifications bar, has a summary of the Campaign Summary.
This one shows
- Campaign
- Service Level (SL)
- Service Level 2 (SL2)
- Abandoned Rate

- Average Hold

- ACD
- Wrap-Up
Voice Campaign Status
| Rw ui textbox macro | ||
|---|---|---|
| ||
Full Detail for queue status in real time. |
| title | Parameters details |
|---|
Campaign: Drop down where you select the campaign to display.
![]() Dialers: When a campaign has dialers assigned to it, this logo will appear next to the combo that allows the user to choose between the different campaigns. By clicking on it, the user will be redirected to the Dialers section. See more about Dialers.
Dialers: When a campaign has dialers assigned to it, this logo will appear next to the combo that allows the user to choose between the different campaigns. By clicking on it, the user will be redirected to the Dialers section. See more about Dialers.
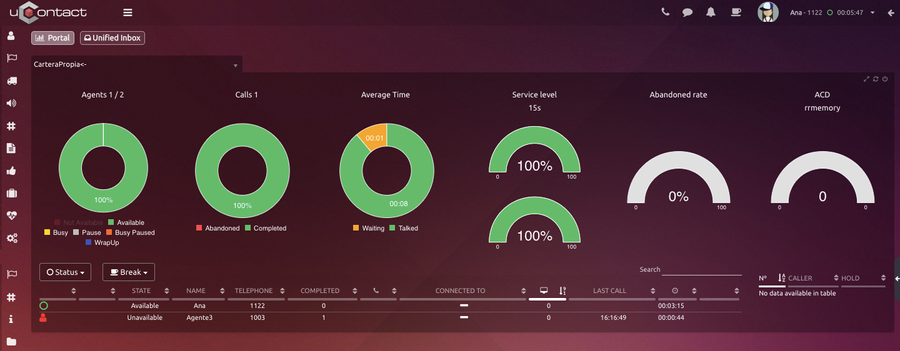
In this view you can see the exact status of a campaign, extensions and real-time statistics.
Agents Dashboard: Shows the amount and percentage of agents on their states (above the graphic we can see how many agents are logged in/total of agents in this campaign).
The states are:
- Not available: Those agents that are not logged in.
- Available: Agents logged without a call.
- Busy: Agents with an active call.
- Paused: Agents on pause state. These can not receive a call and are not currently making a call.
- Busy paused: Agents on pause with an active outgoing call.
- Wrapup: Agents on the wrapup state can not receive a call during the wrapup time to finish its management. The wrapup time is established on the campaign configuration. The wrapup time starts when a call from a campaign finishes.
Calls Dashboard: Shows the amount of completed and abandoned calls (in case of outgoing are the unattended calls or the missed ones).
Time Dashboard: It shows exponential average time of Spoken and Waiting.
- Exponential average: The exponential average is a weighted average from data that emphasises the most recent data. Thanks to this, allows the administrators to react fast to any recent change. The exponential moving average is also known as "exponentially weighted moving average".
- Talked time average: Its the total average of talked time from all the calls made that day.
- Waiting average: Average of the total waiting time from all the calls started that day.
Service Level Dashboard: You can see the percentage of service level of the queue (configured in the campaign parameters). The Service Level is calculated every day. We remind you that the Service Level is the calls percentage that were attended by the agent before a stipulated time. There are two types:
Incoming: Calls answered below the service level. In the Dashboard can be seen the service level in seconds for the calculus of that campaign.About the service level without abandoned(SLNA): In this measurement is taken into consideration the calls under the time limit without the calls that were abandoned previously to the time limit that was configured as threshold. The formula to calculate this, is:
SLNA= (completed inside the SL)*100 / total calls
Where SL means Service Level
For example, if a service level threshold is established for 20 seconds, the calls that are attended inside that time frame, increments the service level, same way, the calls that are attended after the established time, decreases the service level.
In other words, if there are 100 incoming calls, from which 20 are attended after the established time, the service level is 80%.
About the service level with abandoned(SLWA): In this measurement is taken into consideration the calls inside the time limit, and apart from it sums the abandoned calls inside the time limit established as threshold for the service level. The formula to calculate this:
SLWA = (completed inside the SL + abandoned inside the SL)*100 / total calls
Where SL means Service Level
Abandon Rate Dashboard: You can see the percentage of the rate of abandonment of a campaign. The abandon rate is the percentage of calls abandoned during the day. To calculate the abandon rate, all the abandoned calls are counted over the total calls, where for example if 100 calls were made and 20 were abandoned, the abandon rate will be 20%. The following calls are counted as abandoned:
- Abandoned by the client: Calls that the client finishes before it was answered.
- Abandoned by timeout: When a client is waiting to be answered, the call is placed on a waiting queue- That queue has a time called timeout which sets the time limit that the client will wait on that queue. If the call is not answered on that time, the call finishes and it will be registered as a abandoned call.
ACD Graphic: Shows the amount of calls in the ACD (in wait), on the graphic you can find the strategy of distribution of calls for the incoming campaign.
Searches: Both tables have a searching area that allows to filter rows of which columns happen to meet with what was searched for.
| Expand | ||
|---|---|---|
| ||
In the agents dashboard we can see the agents states. Under the dashboard, by clicking on this logo, will unforld filters to select what it is wanted to be seen in the Agents table. The selected filters will be marked with a tick. The filters are the following ones:
|
| title | Agents Status Grid |
|---|
Grid with list of agents that are assigned to that queue.
State: Color identifier extension state.
Type of call: Shows if the call is outgoing (arrow up) or incoming (arrow down).
Name: Agents name.
Telephone: Technology and phone number of the agent.
Opened Forms: Total number of forms opened for each agent. Clarification: If the user left forms opened before logging off, this ones will still appear as opened. When the user logs in again, the forms will get closed. Have in mind the effects on dispositions, depending on the form assigned.
Completed: Number of calls answered (inbound or outgoing).
Duration: Duration of the current or last call made.
Connected to: Telephone number of the last call or current call made or received.
Last call: Date / Time of last call answered.
Time: Shows the time that the agent is on the actual state.
Alert: Column where all configured alerts on the thresholds can be found. These are:
- Red alert icon: Inactivity time (it is shown when the agent passes the defined threshold without receiving any call)
- Yellow Telephone icon: Threshold 1 call time.
- Red Telephone icon: Threshold 2 call time.
- Red break icon: Break threshold.
| Expand | ||
|---|---|---|
| ||
Grid with a list of calls waiting (incoming). Caller ID: Displays the number of the call. Position: Shows the position of the call in the queue. Wait: Timeout waiting for the call queue. |
Real Time Listener Monitor
| Rw ui textbox macro | ||
|---|---|---|
| ||
When selecting an agent from the list, a bar will appear with the monitoring options, which allows us to monitor the agent directly from the computer where the portal is open (without the need of having a specific associated internal) Selecting any of the options (without the stop) a timer begins to run next to the name of the agent. |
| Rw ui textbox macro |
|---|
The options are:
|

| Rw ui textbox macro | ||
|---|---|---|
| ||
In the bottom right corner we can find:
In the lower left corner we see a filter icon which allows you to filter the agents that are available and all, since in several cases there are many agents that could be unavailable and disturb the visual. On the other hand you can use a filter for displaying the agents that are in use and see their activity. |
Agent Profile
| Rw ui textbox macro | ||
|---|---|---|
| ||
When selecting an agent from the table, the info button will appear on the monitoring options. |

| Rw ui textbox macro | ||
|---|---|---|
| ||
Interactions On this screen the user can see his progress, incoming and outgoing calls, sms, mails, as well as interactions with social networks like Twitter or Facebook and the webchat of the day. |
| Expand | ||
|---|---|---|
| ||
The user can also see the time he was logged in, time on breaks, spoken time and time he was free. Free time is the time in which the agent was logged in without being on a break or making a call without having in count the time spoken during a break. The resulting formula is: Free Time = Logged - Spoken - Break + Talked break. Talked break: Is the time that, while being on a break the agent made calls. Real break: Is the total break time, without the time being on a call during a break. |
| Expand | ||
|---|---|---|
| ||
On the right, the user can see a timeline detailing his activities, a table that indicates the time spent on every break and a graph of the day by hour. The graph is divided by hour, it shows the amount of calls and sms of the user (incoming and outgoing). If the mouse pointer is placed over a specific time, the user can see the amount of calls and sms for that hour.
|
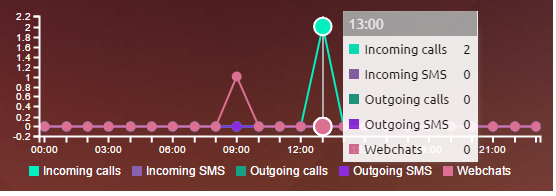
| Rw ui textbox macro | ||
|---|---|---|
| ||
Important
|
Dispositions Dashboard
| type | info |
|---|
To enter this section the user must navigate in the side menu to:
Supervisor → Campaigns
The module of campaign monitoring is divided into five tabs that will have different views of the campaigns that the supervisor has assigned.
This ones are
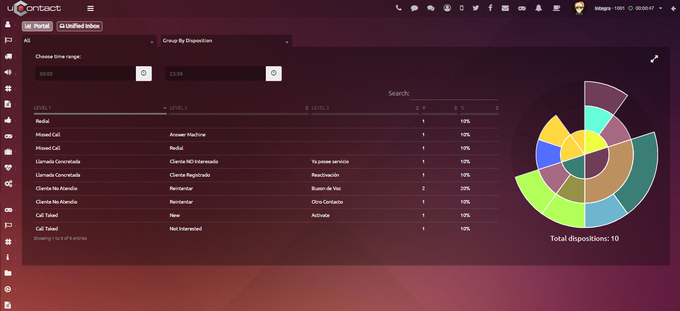
Dispositions Dashboard
In this screen the Supervisor will be able to see the percentaje of
Dispositions in real time or in a predetermined time lapse for each campaign.

| Expand | ||
|---|---|---|
| ||
First Dropdown Menu Allows the Supervisor to filter dispositions by Campaign. If nothing selected, system shows dispositions from all campaigns assigned to current supervisor. If it's a SuperUser will see all the Campaigns. |


Second Dropdown Menu Allows the Supervisor to filter the table by disposition level. If nothing selected, system shows all dispositions. |

 By Agent When this box is checked the table shows the dispositions filtered by agent. |

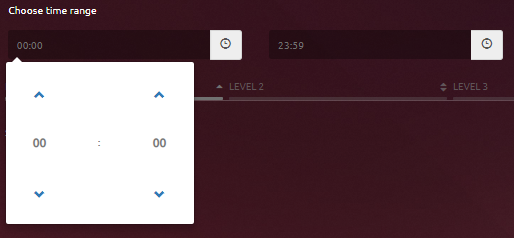
 Time Range Allows the user to put a time lapse using the clock buttons to see the dispositions. If nothing selected, system shows all the dispositions from current day. |

 |
| Expand | ||
|---|---|---|
| ||
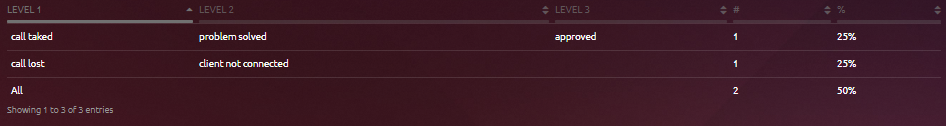
Table shown
|

 |
| Expand | ||
|---|---|---|
| ||
Shows in graphics all the percentages for each disposition, in center it's Level 1, in the middle it's Level 2 and outside it's Level 3. In the bottom side of the graphic is the total number of dispositions. 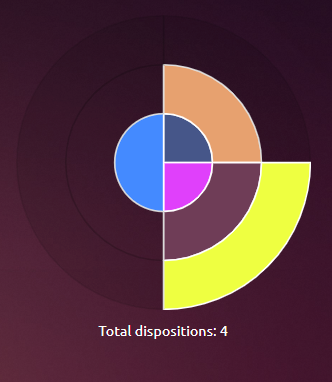 |

| Info |
|---|
It's important to know that every Agent have a button to see his oun Dispositions Dasboard. To learn more about that look at Dispositions Dashboard. |
Campaign Agents
| type | info |
|---|
| type | info |
|---|
General view of campaigns and agents.
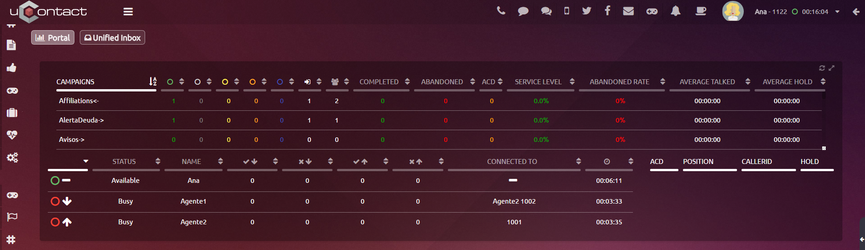
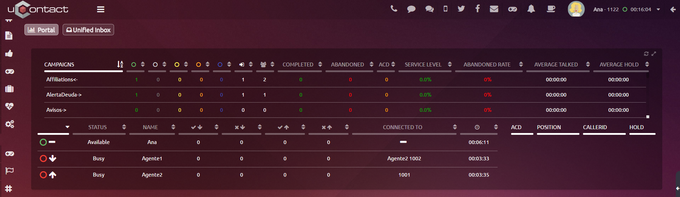
In the first table it can be seen a basic summary of the status of campaigns in real time.
The second table shows all the agents on the system on their actual state, name, amount of incoming/outgoing completed/rejected calls, with who the agent is having an active call and the time indicating their last state.
The table on the right shows the calls on hold, indicating ACD, position, callerid and the waiting time
Omnichannel Campaigns
| Rw ui textbox macro | ||
|---|---|---|
| ||
The campaign status monitoring module is divided into six sections that will allow different views of the campaigns that the supervisor has assigned |
| type | note |
|---|
.
Survey
Complete detail of all
the campaigns with its group of agents, where the supervisor can monitor everything in real time.

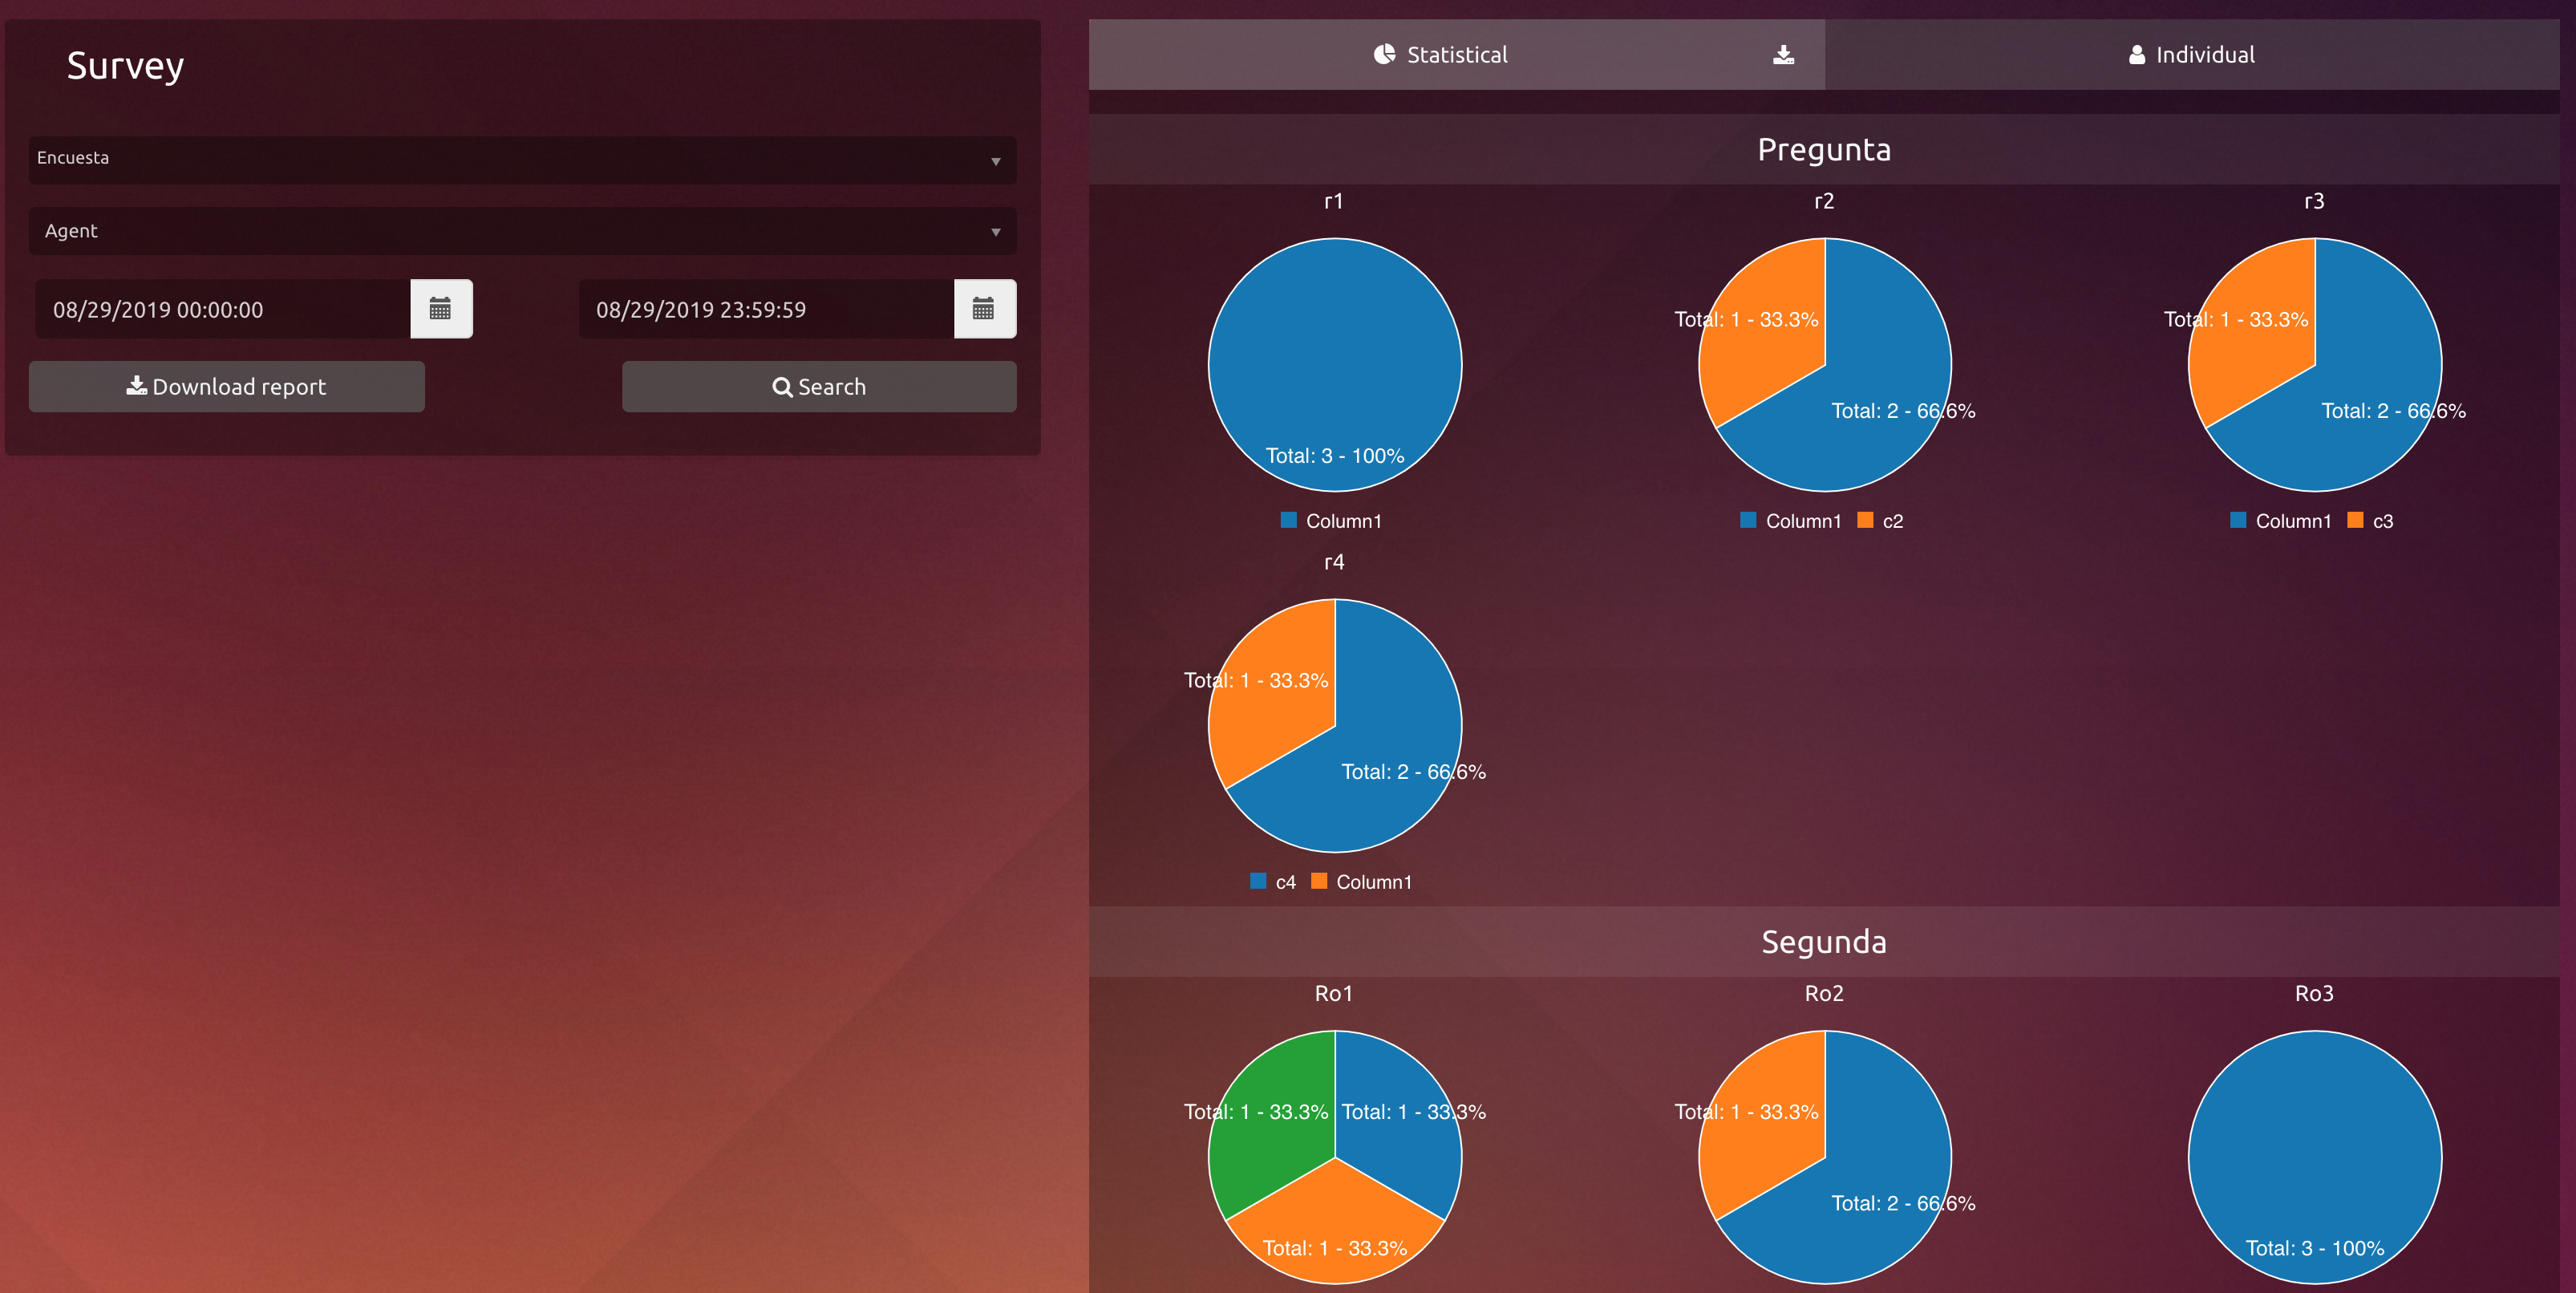
To get more information about this matter, please visit Survey Statistics.