| Table of Contents |
|---|
Introduction
Jaspersoft Studio is a tool that allow us to develop reports.
With this reports we can provide statistical and detailed data to our customers, helping them in their business to take decisions based on real data.
Basic Concepts:
Query:
- is a search to the database to find the information that we need.
...
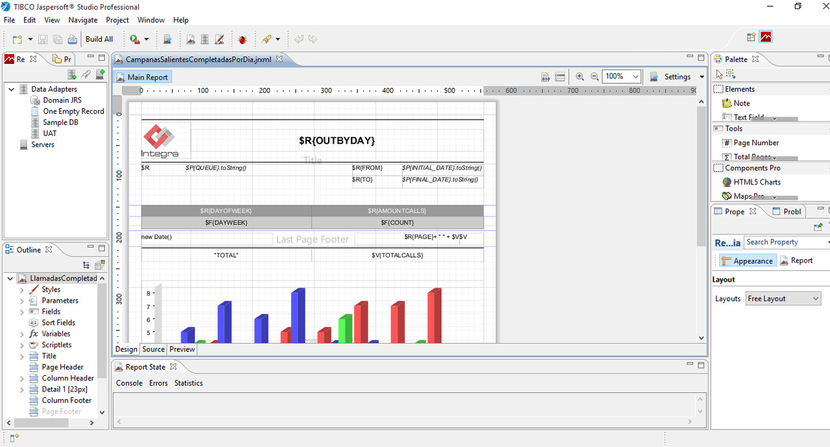
Layout of Jaspersoft Studio
...
In this section we can see the UI of the report to be created.
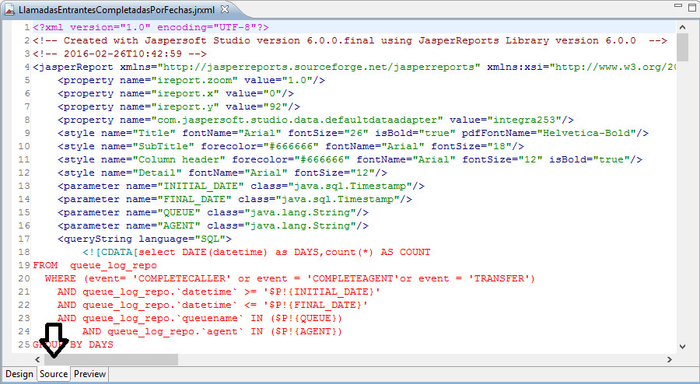
Source:
Show us the XML file of the source code generated by the report designer.
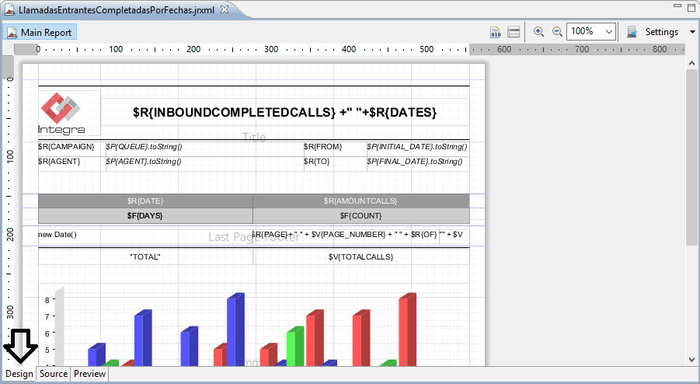
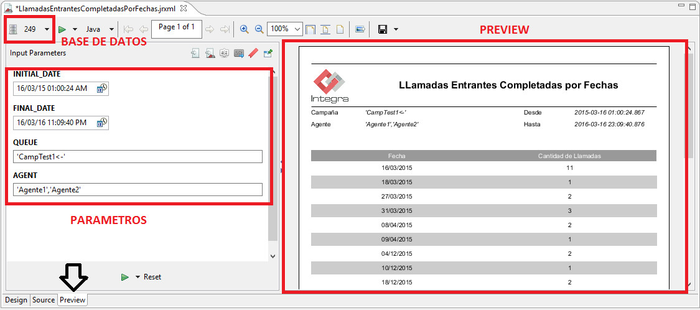
Preview:
We cab generate the report to test it from this window.
...
To download a copy in a format you can click the icon Export and select the file format.
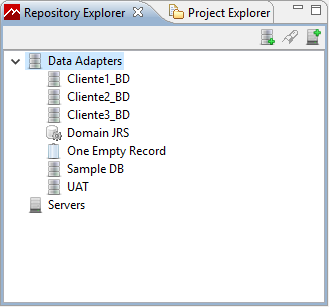
Repository explorer:
In this section we can see all 'Data Adapters' created and you are able to query.
The data adapters are repositories that we create inside Jaspersoft and where we extract the information to generate reports.
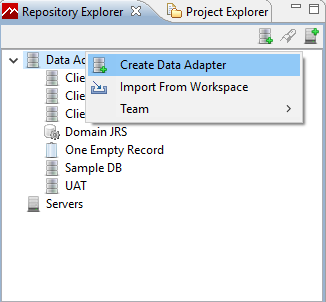
Repository Creation
- Open JasperSoft Studio.
- Expando data adapter on the top left.
- Right click on data adapter by default.
- Click ‘Create Data Adapter’.
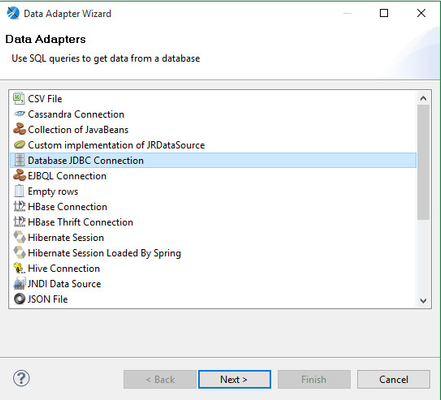
The following window will pop-up and choose 'Database JDBC Connection' then Next.
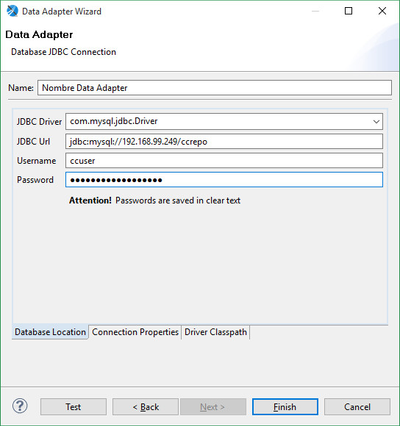
Repository Configuration:
...
(See screenshots example).
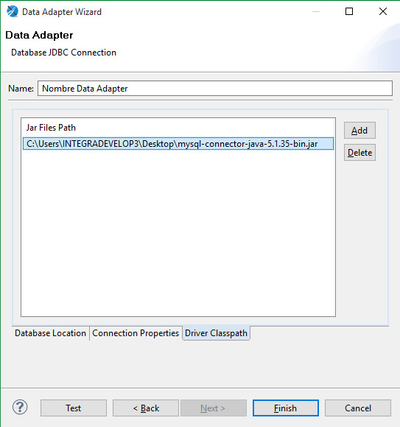
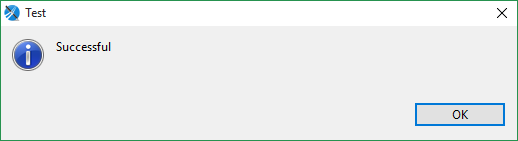
Once driver is added, we click 'Test' to check if the connection is OK.
A message must appear saying that the connection was Ok.
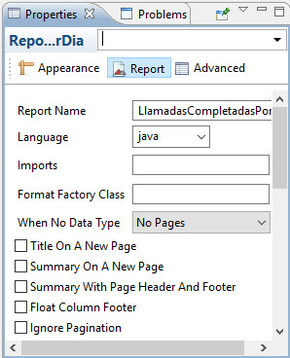
Properties
Properties
Property of a selected element on the Report.
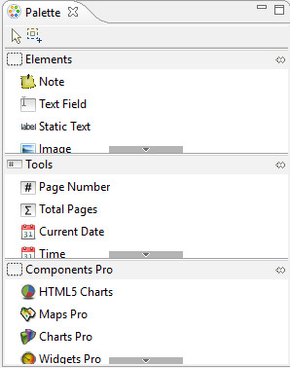
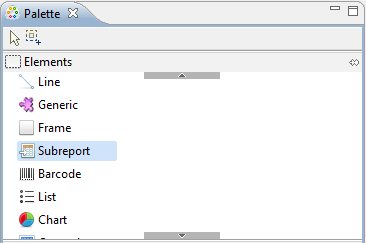
Palette
This section has all the elements we can include inside a report.
Outline
Bottom left we have this window, we can see the report structure in a tree format.
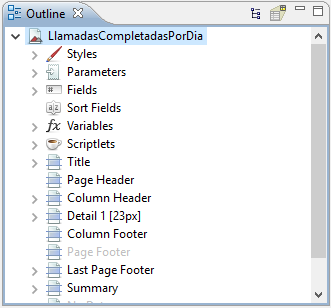
Element of the Outline:
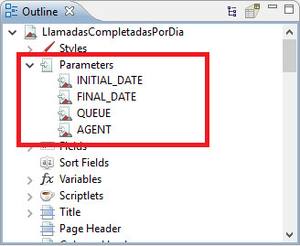
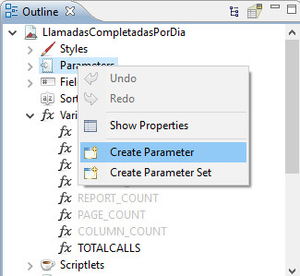
Parameters
- Filters for the query on the report.
Example: If we have a parameter AGENT, then our report sill filter the result for that agent if included on the query.
Notation : $P{name}.
- Creation : Right click on parameters > Create parameter.
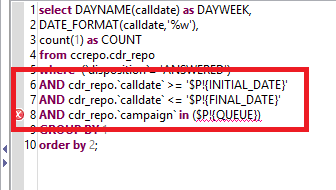
In case of exist parameters in our report, we can use them in the query like this: $P!{nombreParametro}.
...
If the variable has one value, goes like this: WHERE fecha >= '$P!{INITIAL_DATE}’.
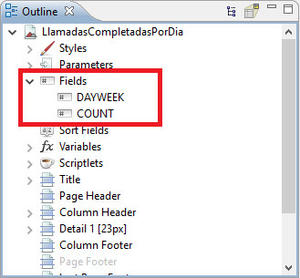
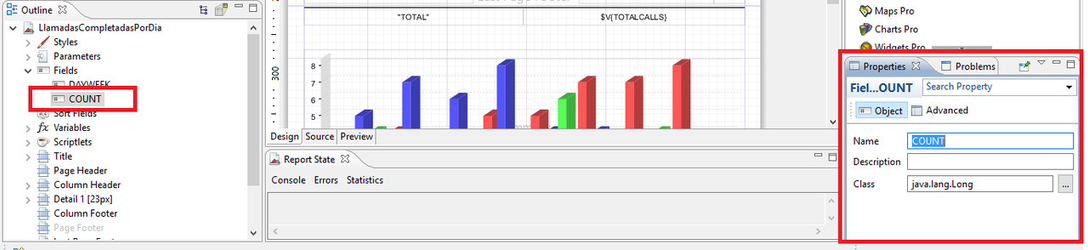
Fields
- This are variables that take the value of a column returned by the query.
...
The fields don't need to have the same name of the column returned by the query but is a nice to have.
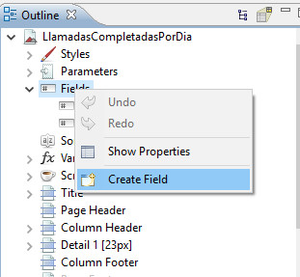
- Creation: Right click on fields > Create Field.
- Type of Field: To specify the data type of our field click on the created field and in the properties windows we have class where we put the data type of the field.
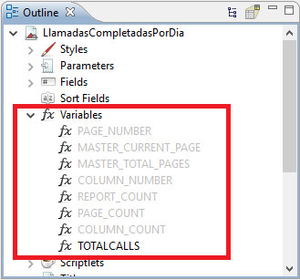
Variables
- The variables are for store a determinate value. Used to save mathematical expressions.
...
Expression: $F{comision} * ($F{over_total}==true$F{import_agent}:$F{from}) + $V{comisioncamp}
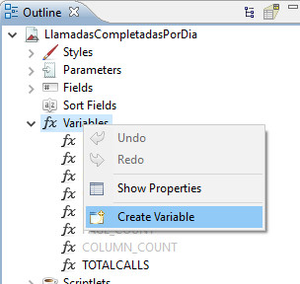
- Creation: Right click Variables > Create Variable.
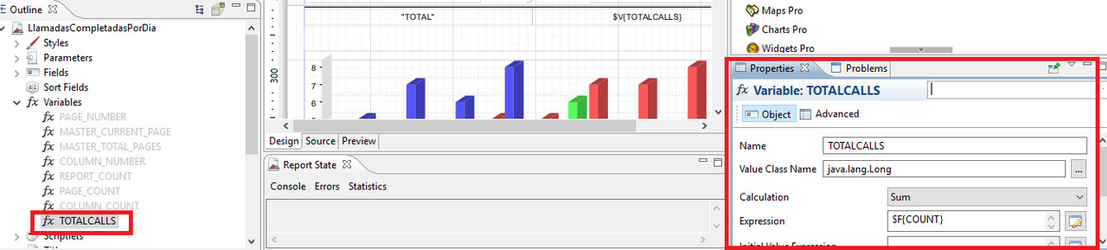
- Expresión: To change the expression of a variable select variable > Change field Expression on Properties view.
- Type: To change the type of a variable select variable > Change ‘Value Class Name’.
Edit Expressions
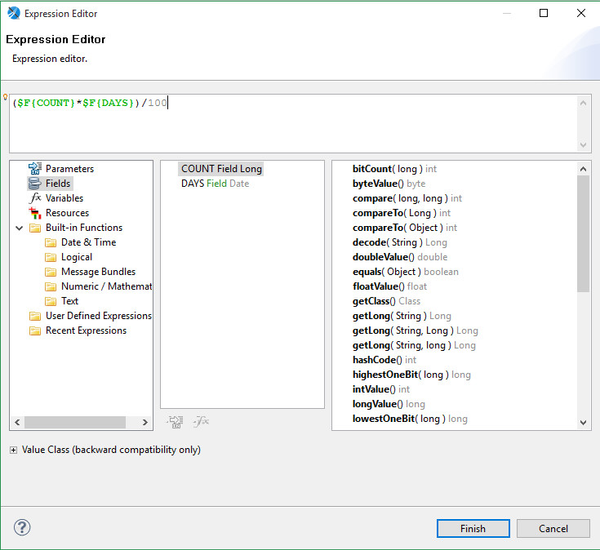
Query
- Usually we have one query that will return all data we need to show.
- We can access a column using the fields.
- To crete a query right click on our report in Outline then click on ‘Data Set and Query’.
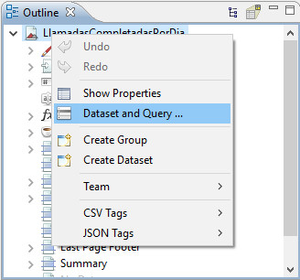
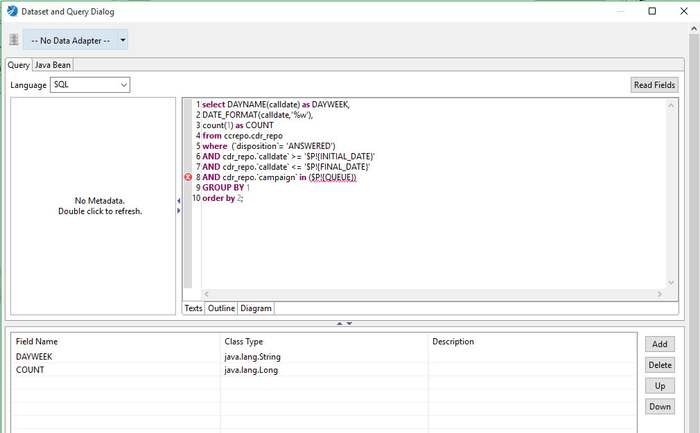
As explained above, the query returns the data that we want to show.
...
- ¿Where and how these data show?
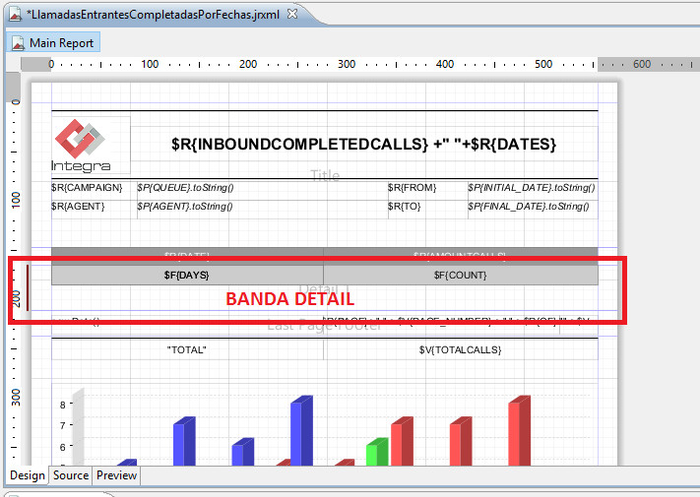
Detail
By default the report creates an element Detail.
...
For each row of the query we will have a detail withe the data of the fields.
Group
Allow us to group collection of rows of the details in real groups.
...
Is important to show the different between the Groups and the Group By of SQL.
Groups: Group rows of a column in a secuencial way.
Example:
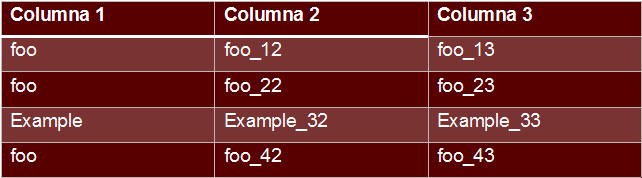
If we create a group for Columna 1,the result is:
...
Example_32 Example_33
Group: foo
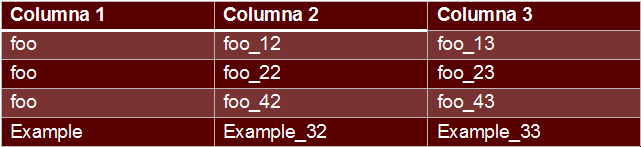
No all elements foo are under the same row, this is the main difference with GroupBy.
...
In this case the result is:
To create a new group:
- Right click on the report outline.
- Create Group.
- Add a name and select the element we want to be part of the group.
...
In this way we avoid it is the header without the associated detail.
TextField
Free text field.
...
To show a textfield element we can do it in 2 ways, draggin the same textfield or modifying the regular expression of the textfield.
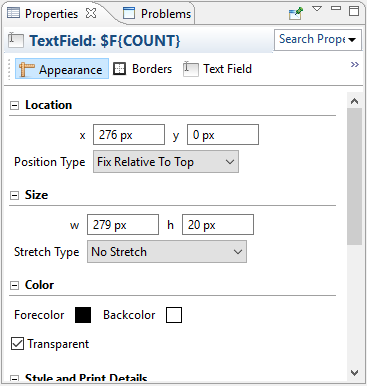
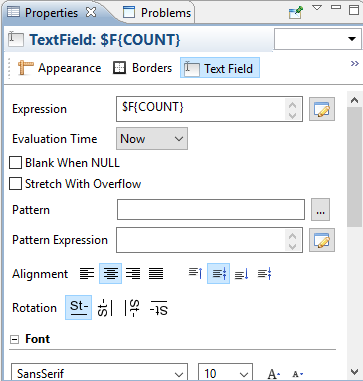
Properties of the Textfield
Appearence: Modify the look and feel of the textfield. location, size and color.
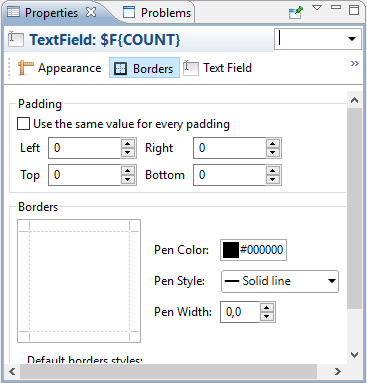
Borders: Edit the borders of a textfield.
Textfield: Allow us to modify the expression of the textfield.
...
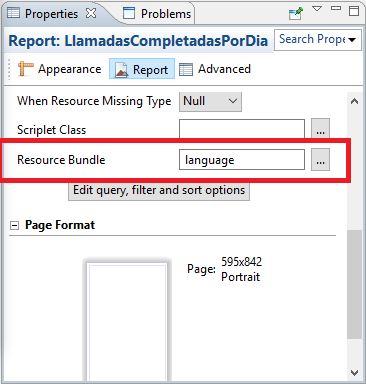
Internationalization
...
To add a file of internationalization of Integra, we must follow some steps:
...
Select the internationalization file integra.resources.language
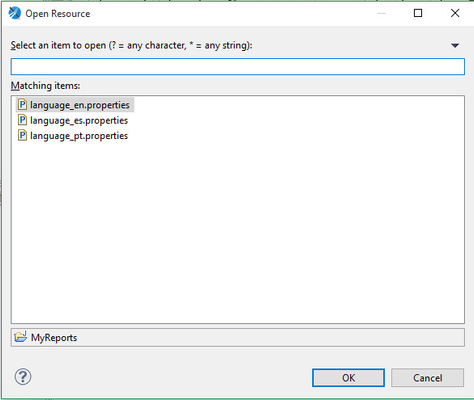
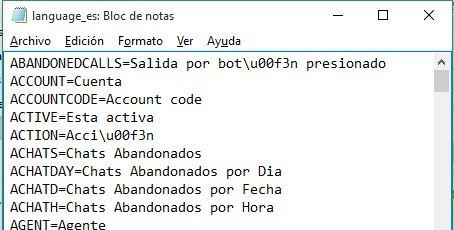
You have to add the variables to the properties files in all the languages: language_es.properties, language_en.properties y langauge_pt.properties
...
If has especial characters (accent, ñ, others) use unicode example ó = \u00f3. Distribution would be Distribuci\u00f3n.
Then on the report we put the titles and headers with TextField that point to this values: Example: INITIAL_DATE a Text Field with the Expression $R{FROM}.
...
Example to test español put resource bundle ‘language_es’.
Subreports
The subreport is to decouple login inside the same report.
To add a subreport we have to drag the control subreport from the palette on the right top.
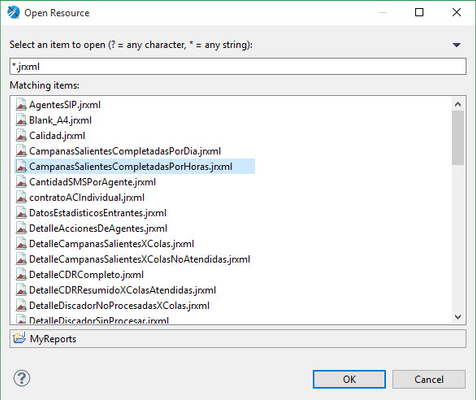
In our case we want the report that already exists so we click in the option select report file, otherwise we create a new one.
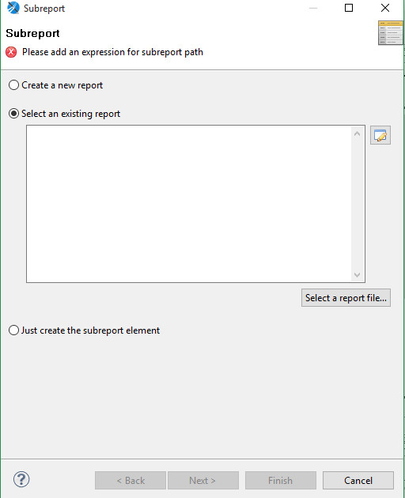
We add an existing one.
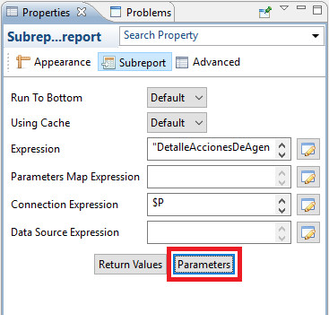
Pass Parameters:
From the main report we can pass parameters to the subreport to filter the subreport query.
...
The main reports returns AGENT and CAMPAIGN, then the parameters or filters we can pass to the subreport are the values returned by (AGENT and CAMPAIGN).
We make a relation between the subreport parameter that we want to return as a global variable (from our main report)
...
In the window of properties of subreport, under the tag off subreport we click in Return values.
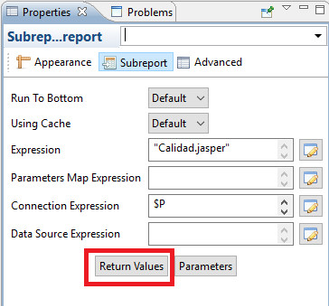
We make a relation between the variable of the subreport that we want to return with a global variable (of our main report).
NOTE: Make sure both variables (subreport and main report variable) be the same type.
DataSets
- Collection of data.
- Has different columns (fields).
- When a new record is created on the dataset, this fields are added.
- Each dataset is independent, has its own datasource.
...
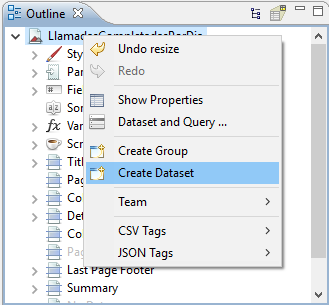
Right click on the report outline and select Create DataSet.
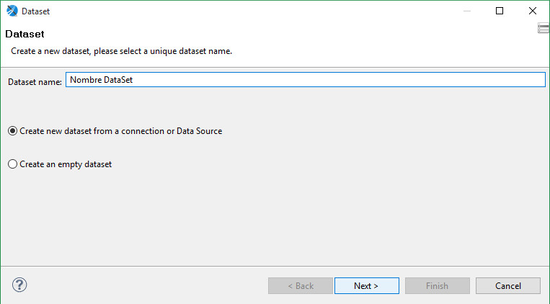
Assing a name and create a dataset from a connection datasource, and click Next.
Select database, and add a query, then Next.
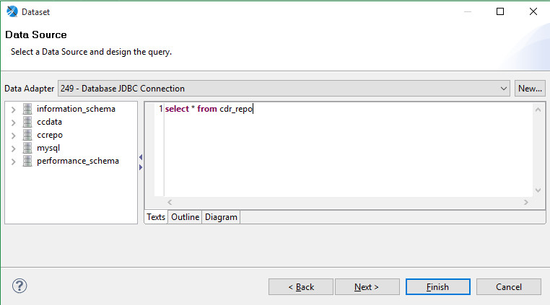
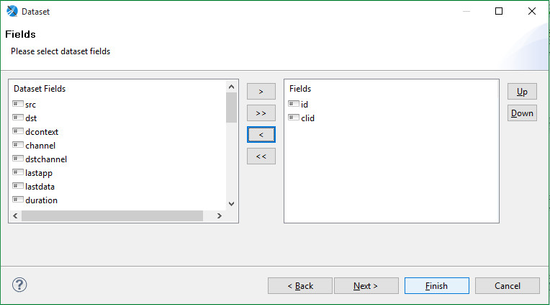
Select the fields we want to get.
...
If not group and want to finish, click Finish.
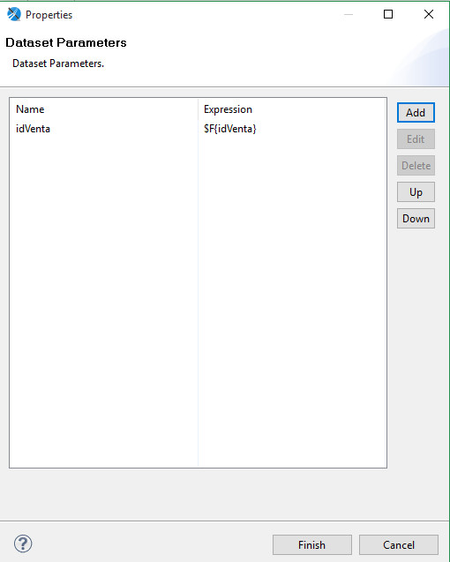
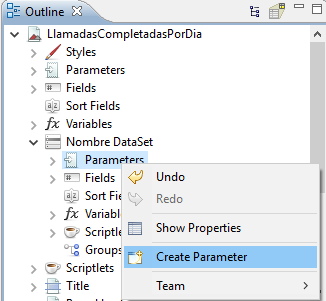
If we want to add parameters to the dataset on the control dataset of the outline right click on Parameters and Create parameter.
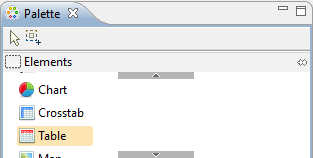
Table
Tables are a way to show data from a dataset.
Use it from the Palette.
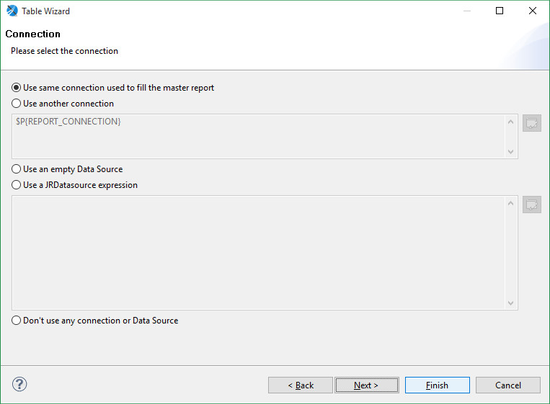
Select the dataset for the source of the table content.
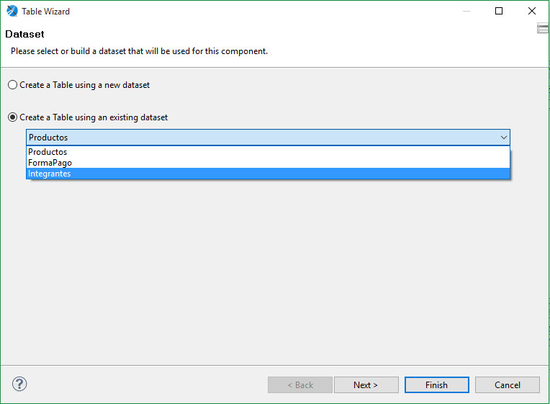
Select same connection and click Next.
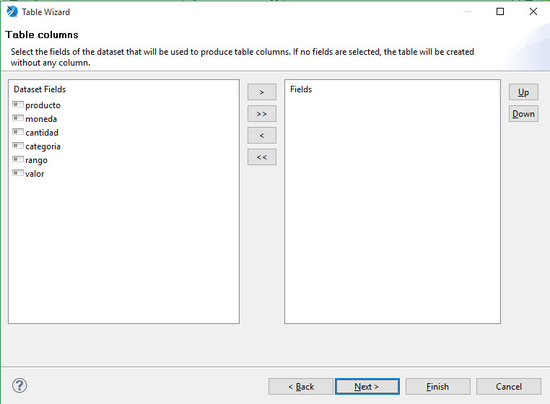
Select fields of the dataset to show on the table.
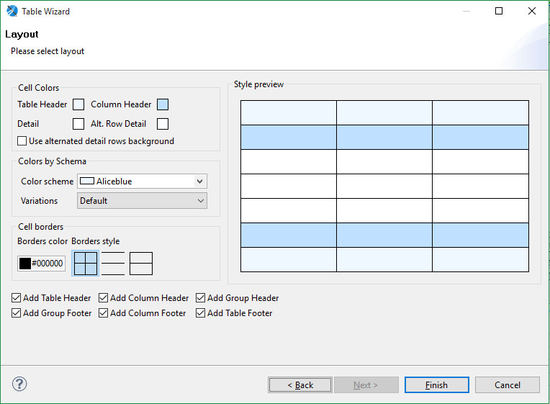
Edit table layout, and click in Finish.
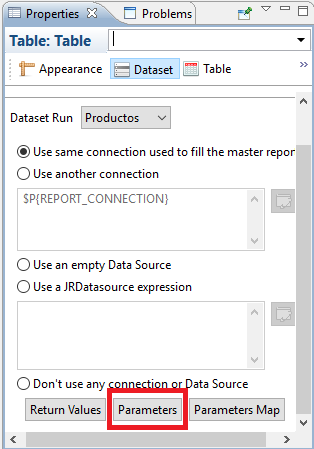
After table created, go to properties under dataset and Parameter button.
Add a line to add the expression of the parameter from the main report to associate.